See the structure while it forms.
Most traders mark their highs and lows by hand, then argue with their own chart. Was that a real break, or just a wick? Structure Map reads market structure by fixed rules that you define and draws it live, the same way every single session. No redrawing, no hindsight, just structure.
• Swing and micro structure at the same time, kept visually apart: see where the bigger picture is heading and whether the structure underneath has already turned
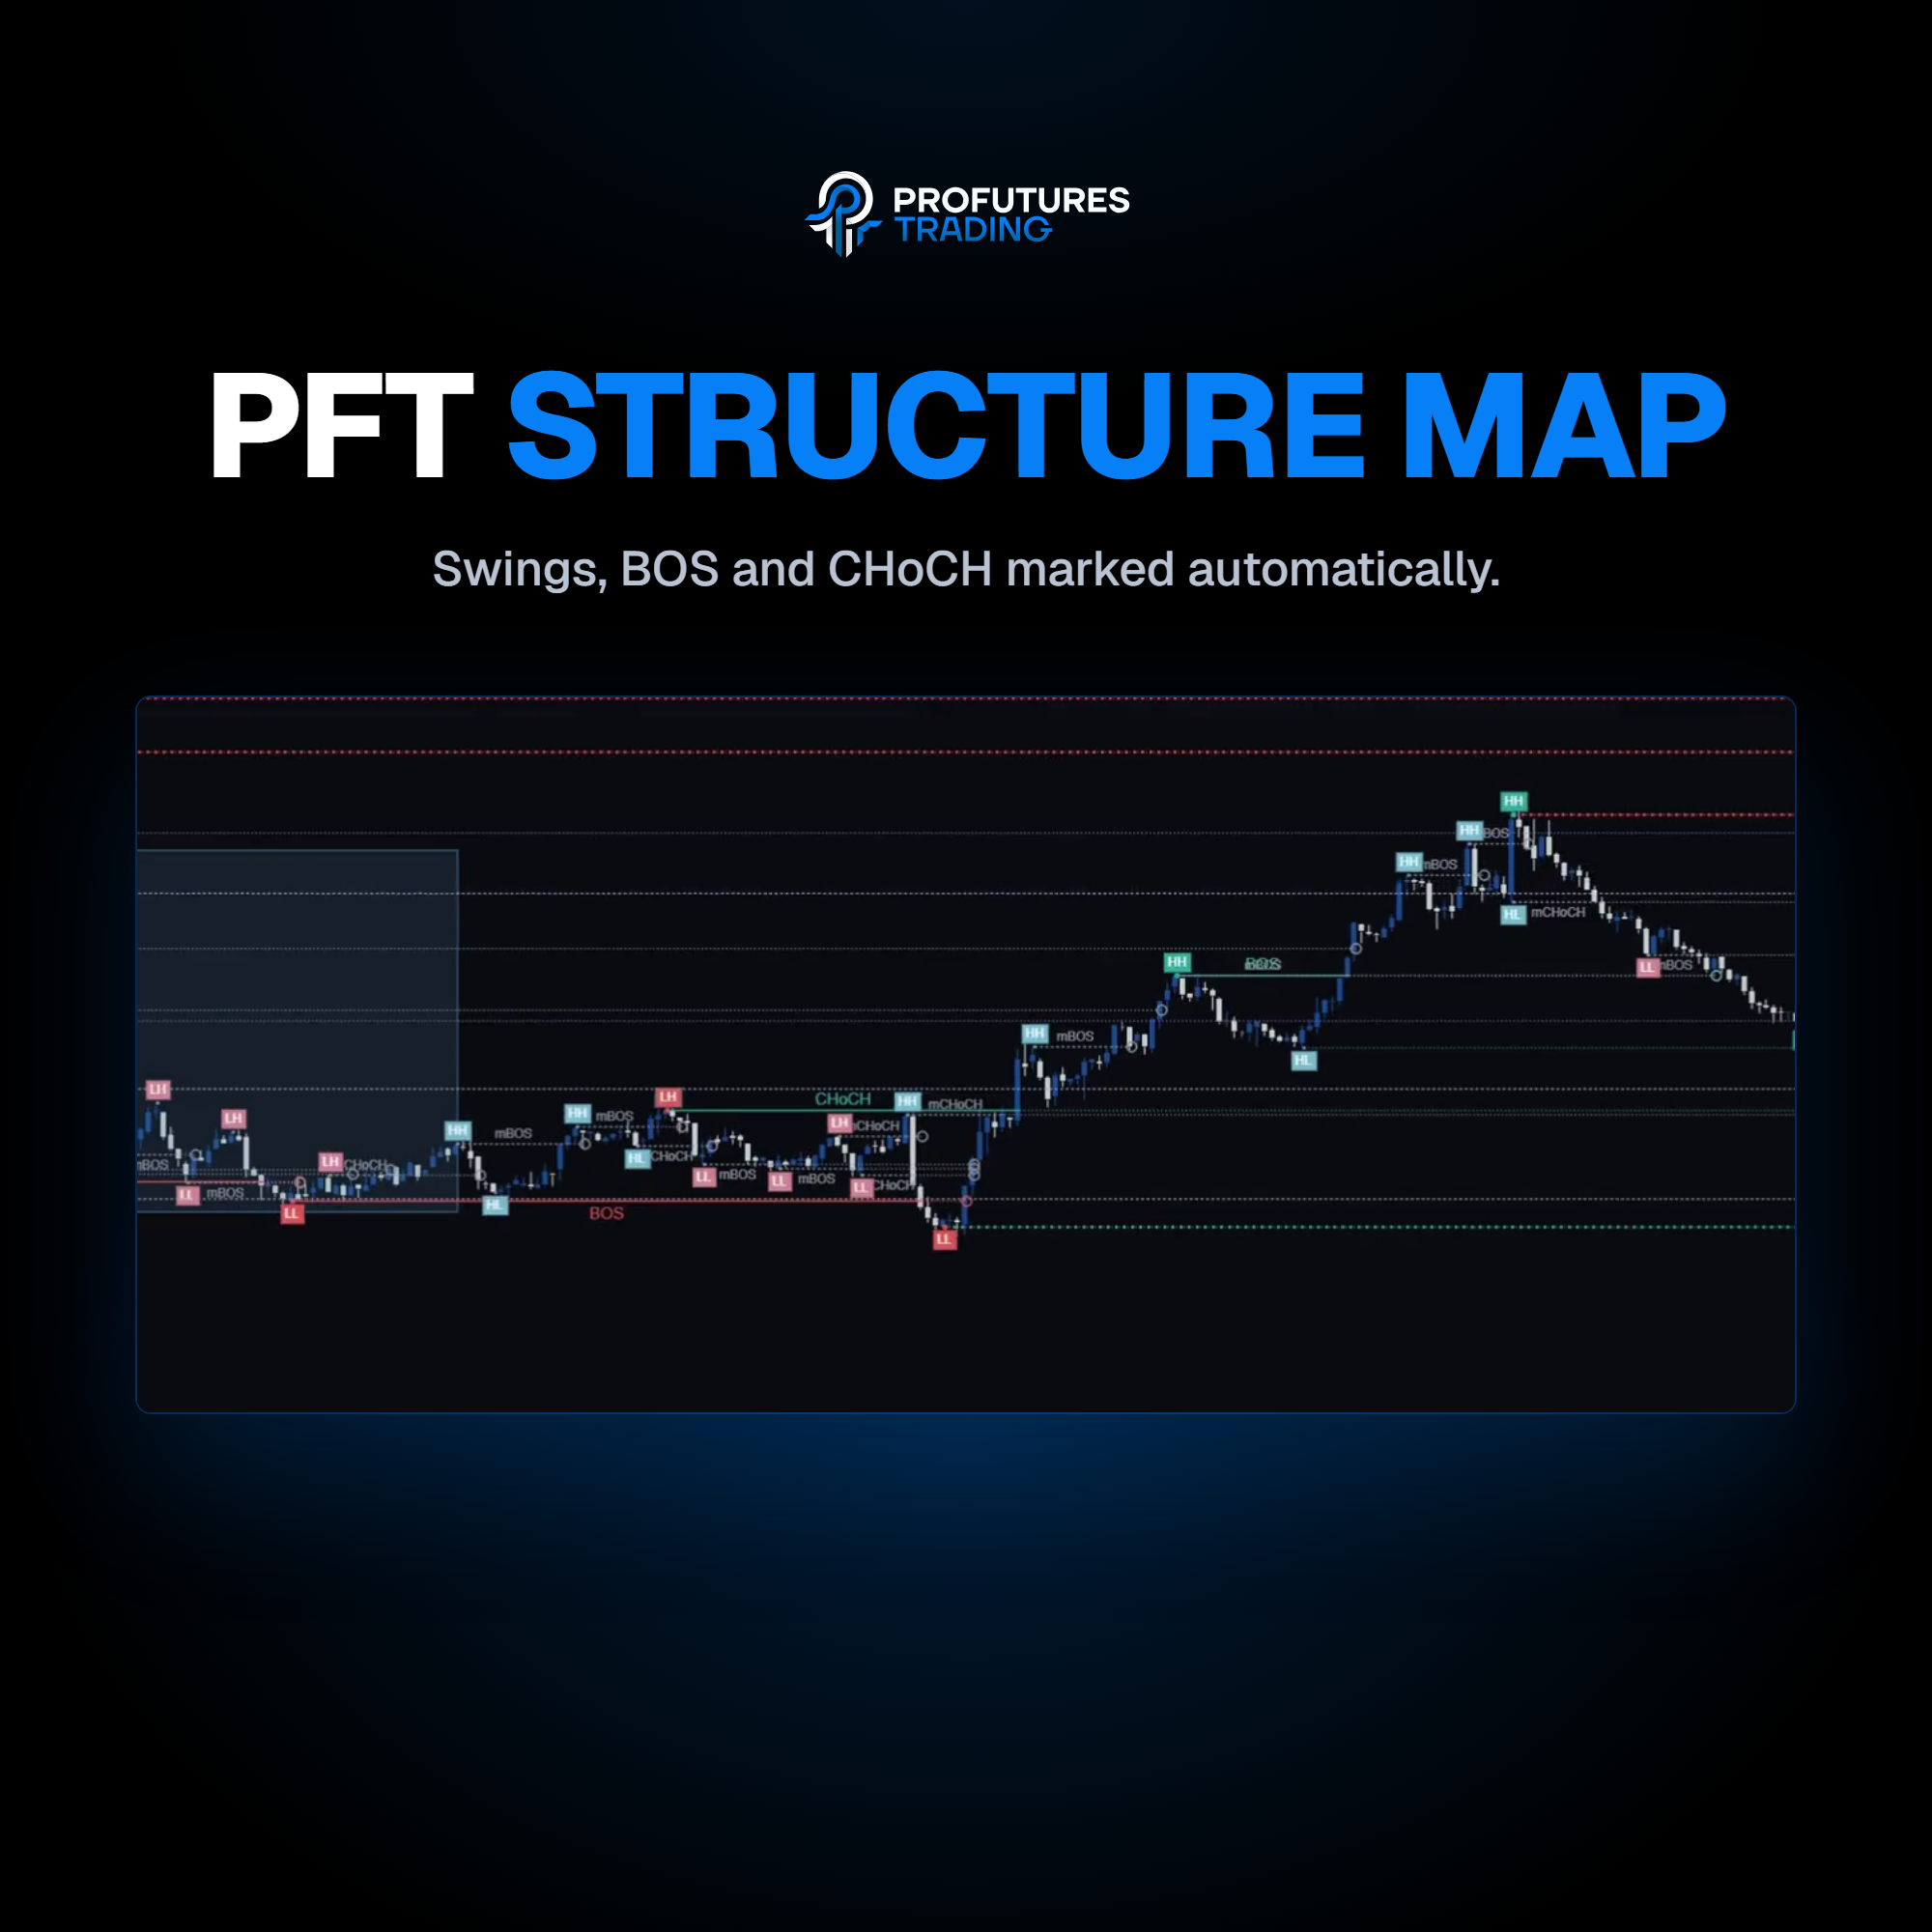
• Pivots labelled as HH, HL, LH and LL, every BOS and CHoCH marked on both layers
• Liquidity pools above and below price, and a flag the moment a stop raid takes one out
• Previous day and week levels, session boxes, the Asia range and the midnight open, on the chart before you sit down
• You decide what counts as a break: wick beyond, close beyond, or two closes beyond, applied identically every day
• Runs natively on ATAS Classic and ATAS X (Windows and macOS); one subscription covers both
• No installation: the licence is activated automatically on your ATAS account and the indicator appears directly inside ATAS
• Monthly, cancel any time
• Also included in the PFT Market Suite
Made for traders who work from price action and keep losing the thread between timeframes: who took a long into a level they would have seen on the higher timeframe, or sat out a clean move because their markup was three days old.
The market leaves the same footprints every session. The edge is reading them the same way every time.
Structure Map shows structure, not buy or sell signals, and it is not investment advice. The entry is still your decision; manage your own risk. Trading futures involves substantial risk.
Most traders mark their highs and lows by hand, then argue with their own chart. Was that a real break, or just a wick? Structure Map reads market structure by fixed rules that you define and draws it live, the same way every single session. No redrawing, no hindsight, just structure.
• Swing and micro structure at the same time, kept visually apart: see where the bigger picture is heading and whether the structure underneath has already turned
• Pivots labelled as HH, HL, LH and LL, every BOS and CHoCH marked on both layers
• Liquidity pools above and below price, and a flag the moment a stop raid takes one out
• Previous day and week levels, session boxes, the Asia range and the midnight open, on the chart before you sit down
• You decide what counts as a break: wick beyond, close beyond, or two closes beyond, applied identically every day
• Runs natively on ATAS Classic and ATAS X (Windows and macOS); one subscription covers both
• No installation: the licence is activated automatically on your ATAS account and the indicator appears directly inside ATAS
• Monthly, cancel any time
• Also included in the PFT Market Suite
Made for traders who work from price action and keep losing the thread between timeframes: who took a long into a level they would have seen on the higher timeframe, or sat out a clean move because their markup was three days old.
The market leaves the same footprints every session. The edge is reading them the same way every time.
Structure Map shows structure, not buy or sell signals, and it is not investment advice. The entry is still your decision; manage your own risk. Trading futures involves substantial risk.